Connector Industry Sales Performance – Last 10 Years
The connector industry achieved a compound annual growth rate (CAGR) of +6.3% for the past 10 years (2002-2012).
This is reasonably good growth over 10 years, but it’s been a rocky road, as the following chart shows:
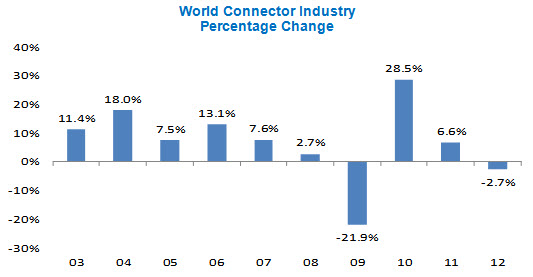
Between 2002 and 2007, the industry grew a whopping +11.5% CAGR. Then in October 2008, the housing market crashed, the stock market plunged, and the global financial crisis impacted nearly every industry. In 2009, the connector industry experienced a -21.9% downturn in sales, setting a new record for a sales decline in one year. World connector sales went from $45.7 billion in 2008 to $35.7 billion in 2009. The industry lost $10 billion in sales in one year.
These sales were recovered the following year, in 2010, when sales increased +28.5% and the industry grew to $45.9 billion.
Since 2010, world connector demand has been modest, growing +6.6% in 2011, declining -2.7% in 2012, and then up a modest +2.4% year-to-date in April 2013. Beginning in October 2011, we experienced 19 consecutive months of very lethargic connector demand.
The following table displays the industry’s sales performance since 2002. You will note that the industry has achieved a paltry CAGR of +1.4% in the past five years (2007-2012).
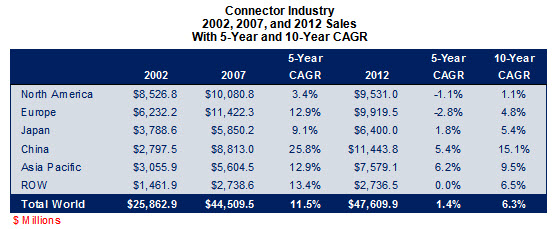
Since 2008, North America declined -1.1% and Europe declined -2.8%. Japan had modest growth (+1.8%) and China and Asia Pacific grew +5.4% and +6.2%, respectively.
Performance of Industry Leaders
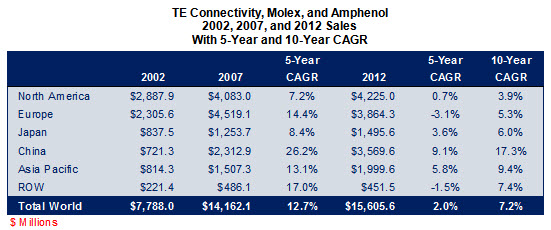
Combined sales of Amphenol, Molex, and TE Connectivity were slightly better than the industry average over the past 10 years (2002-2012). The three companies achieved a +7.2% 10-year CAGR versus the industry average of +6.3%.
The following table shows their combined sales performance.
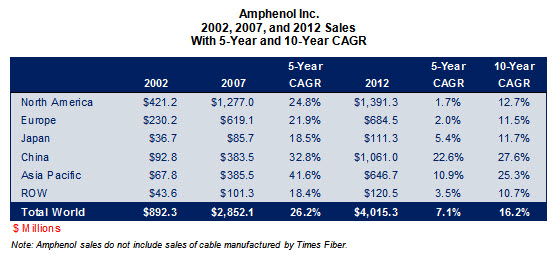
Amphenol Corporation
Amphenol achieved an incredible growth rate of +16.2% since 2002 versus industry growth of +6.3%, making the company the industry’s best sales performer.
As the following table displays, Amphenol has grown to a $4 billion connector company in 2012.
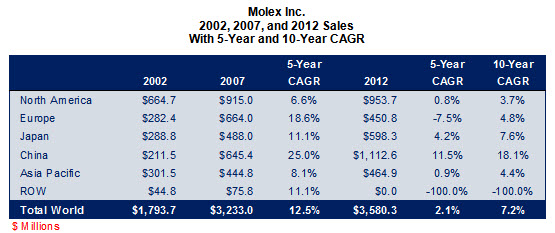
Molex Inc.
Molex is now a $3.6 billion connector company, achieving a +7.2% 10-year CAGR versus the industry of +6.3%.
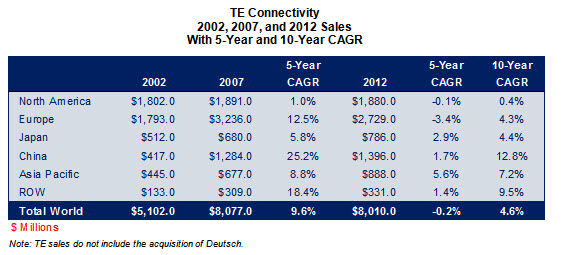
TE Connectivity
TE achieved a 10-year CAGR of +4.6% versus industry growth of +6.3%. While they are slightly below industry performance, TE increased annual sales by $3 billion, from $5.1 billion in 2002 to $8.1 billion in 2012.
No part of this article may be used without the permission of Bishop & Associates Inc.
If you would like to receive additional news about the connector industry, register here. You may also contact us at bishop@bishopinc.com or by calling 630.443.2702.

- Is the Gold Rush Over for China Connector Sales? - October 17, 2023
- The Top Five European Connector Suppliers for Product Quality and Price Competitiveness - October 10, 2023
- 2023 Top Five European Connector Suppliers - September 26, 2023