Global Connector Sales See Strong Growth Across Regions and Markets
Technological solutions to humanity’s pressing challenges continue to drive connector sales growth. A new market research report on the global connector sales puts a number on humanity’s increasing reliance on connected technologies.

Although the decade is still young, the 2020s have already been defined by significant challenges, including increasing natural disasters, wars, geopolitical tensions, and a global pandemic. COVID-19 continues to create problems across the electronics industry, and repeated factory shutdowns and shipping challenges have upended material and component availability. Even so, the electronic connector industry has not just weathered this period of turbulence, it has grown stronger as connected technologies have proliferated and driven new investment into high-tech solutions to the world’s problems.
Global Connector Industry Sales
A new market research report from Bishop & Associates reveals that global connector industry sales grew by $15.264 billion from 2020 to 2021, with sales increases of +24.3%. In every region in the world, Bishop recorded significant increases in connector demand, led by rest of world (ROW) countries at 31.2%; by Europe at 26.4%; and by Asia-Pacific regions at 25.9%.
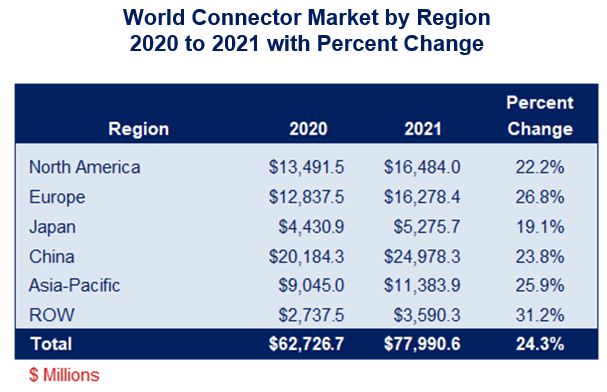
The dramatic shifts in regional connector demand have slowed down from the early 2000s, when many companies moved factories to China and smaller manufacturing centers in Asia. At the beginning of the century, North America had a 38% share of the connector market (2000-2001). Over the last 22 years, North America’s share has dropped to 21.1% (2000-2021). From the period 2012 through 2016, North America’s share seemed to hover around 21%, but in 2017, market share declined sharply, falling below the level seen in 2013. In 2019, North America gained .08% in market share, and has seen market share stay above the 21% mark since then. Over the last 20 years, Europe and Japan have also lost market share.
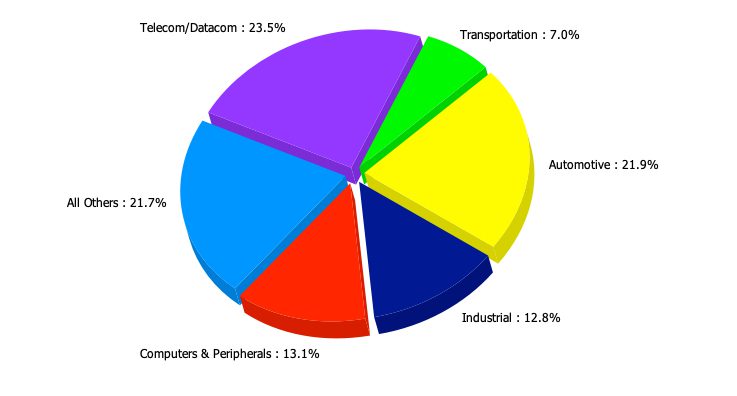
When we look at the shifts in demand by end-use market, we see the rising dependance on connected technologies at play on a global and societal level. Ongoing shifts to digital workplaces and online activities in every field are driving a tremendous growth in digital infrastructure. That in turn has spurred acceleration in infrastructure investment to support the bandwidth and speed requirements of those technologies. The continuing rollout of 5G is driving significant demand in interconnects and supports adjacent growth of IoT technologies and Industry 4.0 production processes. Bishop finds that the telecom/datacom sector was the largest end-use equipment sector for electronic connector products in 2021, with shipments of $18.301.3 million.
Automotive has held the top position for the last several years. As vehicles integrate more smart connectivity features, including autonomous content in safety and driver assist technologies, as well as electric drivetrains, demand in this market will remain very strong. However, it was anticipated that this market would lose its top position in 2020 due to the huge decline in automotive sales spurred by the COVID-19 pandemic and component shortages. That challenge has carried over into 2021 due to ongoing shortages of semiconductor chips. In 2019, automotive accounted for 23.7% of all connectors manufactured in 2019. In 2020, automotive accounted for 22.6%, and in 2021 accounted for 21.9%.
World Connector Market – Top Five Equipment Sectors – 2021
With shipments of $25.426 billion in 2021, printed circuit board connectors were the largest individual category of connectors. Printed circuit board connectors accounted for 32.6% of all connectors manufactured. Application-specific connectors ranked second with 17.5% of the total market.
Bishop & Associates’ new report, World Connector Market Handbook, shares in-depth analysis of connector use by region, industry, end-use equipment sector, and connector category. This 230-page research report includes detailed statistics for each region with historical data from 1981 through 2021 and examines key product lines, end users, and growth projections for the years ahead. Click here for more information.
No part of this article may be used without the permission of Bishop & Associates Inc. If you would like to receive additional news about the connector industry, register here. You may also contact us at bishop@bishopinc.com or by calling 630.443.2702.
Like this article? Check out our other Market Update and Facts and Figures articles, and 2022 Article Archives.
Subscribe to our weekly e-newsletters, follow us on LinkedIn, Twitter, and Facebook, and check out our eBook archives for more applicable, expert-informed connectivity content.
- Amphenol is On a Roll - April 2, 2024
- 2023 Top Five European Connector Companies for On-Time Delivery and Technical Support and Expertise - October 24, 2023
- New Report Examines Performance and Outlook for the European Connector Industry - July 11, 2023