Part 1: 10-Year Snapshot of the Connector Industry 2003-2013
10-Year Snapshot of the Connector Industry
The phrase “significant change” doesn’t adequately describe what happened in the connector industry over the past 10 years. Specifically, between 2003 and 2013, the connector industry:
- Experienced roller coaster swings in connector demand, setting new industry records for declines and increases
- Suffered the worst price erosion in decades, followed by a period of price increases and price stability
- Witnessed major changes in the competitive landscape through mergers and acquisitions
- Adapted to major changes in technology
Roller Coaster Demand
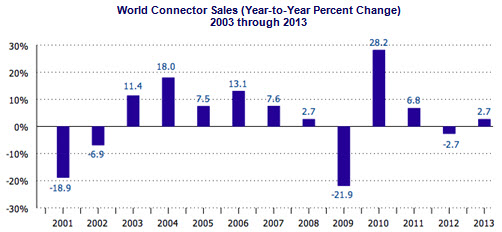
In 2003, the connector industry began to recover from the dot-com crash. World connector sales increased 11.4% after sales declines of -18.9% in 2001 and -6.9% in 2002. The years 2003 to 2007 were golden years with connector demand achieving an 11.4% five-year CAGR. Then demand plummeted to -21.9% in 2009, due to the housing bubble and the ensuing financial crisis. This was a historical low in industry history, only to be followed by the largest ever one-year increase of 28.2% in 2010.
The following chart clearly shows the roller coaster demand. We believe anyone who can successfully manage a connector company through sawtooth demand of this nature could successfully manage any type of business.
Manufacturing Exodus from West to East
These periods of dramatic swings in demand were exacerbated by the world-changing migration of manufacturing from North America and Europe to China. This event caused a great upheaval in resources of manpower, machinery, and capital.
Consider that in 2003, North America and Europe accounted for 55% of world connector demand. In 2013, that dropped to 40% of world demand. The 15-point drop in market share equates to $7.3 billion in connector demand that moved from west to east. The market share decline also means that there are approximately 49 million less jobs in Western economies.
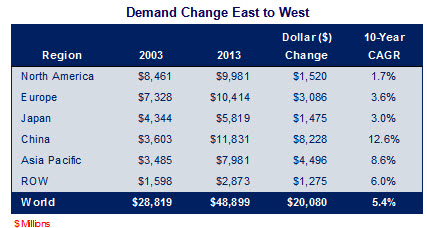
Clearly Asia has been the growth engine for the connector industry, especially in China, with a 10-year CAGR of 12.6%, versus only 1.7% in North America.
It is equally clear that the connector industry went through a fundamental, landscape-changing period between 2003 and 2013. Imagine the difficulty of managing a business that experiences historical highs and lows in demand while being compelled to transfer billions in assets to other geographic regions.
Part two of this article will address the past 10 years of price erosion, increased prices of raw materials, merger and acquisition activity, and technology changes.
For more detailed information on changes in the connector industry over the past 10 years see Bishop & Associates new report Connector Industry Forecast.
Ron Bishop, President, Bishop & Associates, Inc.
No part of this article may be used without the permission of Bishop & Associates Inc.
If you would like to receive additional news about the connector industry, register here. You may also contact us at bishop@bishopinc.com or by calling 630.443.2702.
Subscribe to our weekly e-newsletters, follow us on LinkedIn, Twitter, and Facebook, and check out our eBook archives for more applicable, expert-informed connectivity content.

- Is the Gold Rush Over for China Connector Sales? - October 17, 2023
- The Top Five European Connector Suppliers for Product Quality and Price Competitiveness - October 10, 2023
- 2023 Top Five European Connector Suppliers - September 26, 2023