Facts & Figures: Calculating Total Available Market
How big is the connector industry? Ron Bishop explains the facts and figures of calculating total available market, but you must first put a fence around the connector industry.
How big is the connector industry?
There are many answers to that question depending on the criteria you are measuring:
- Region of the world
- Country
- Market sector
- Product type
- Market sector within region
- Market sector by country
- Product type by region
- Product type by country
- Product type by market sector, within region, within country
- And more
Answers to these questions are critical to determining the size of your company’s total available market (TAM). Regardless of the size of a company, TAM is a subset of the answers to the above questions. TAM cannot be accurately calculated without first identifying the size of the overall market broken down into the segments noted above.
Connector Market by Region: The First and Highest Level
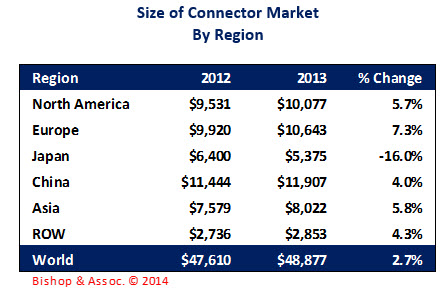
The connector market achieved 2013 sales of $48,877 million, growing +2.7% from $47,610 million in 2012.
The following table sizes the 2012 and 2013 connector market by geographic region:
Size by Country: The Second Level
Bishop & Associates identifies the major countries in each region and then determines the size of connector demand in each country. The firm further segments sales in each country by market sector and product type, all critical information, to identify total available market (TAM):
- North America is broken out into three countries: US, Canada, and Mexico.
- Europe has 18 countries with Germany, by far, the largest for connectors.
- Japan and China are defined as standalone regions because of their size.
- Asia Pacific is broken down into 10 major countries, with South Korea the largest for connectors.
- The rest of the world (ROW) is broken down into four major countries, with Brazil being the largest.
Europe by Country
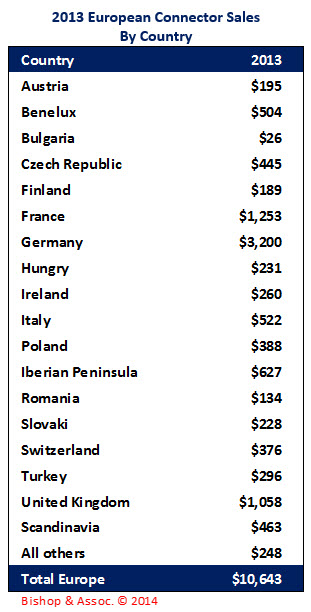
As noted, we break Europe out into 18 major countries, plus a few smaller countries defined as “all others.”
The following table identifies each European country and 2013 market size:
If you would like to determine your TAM, there are two Bishop research reports that would be useful:
Did you know that connectors and cable assemblies combined create a $175 billion industry? Check out our report on the worldwide cable assembly market.
If you have questions regarding this article, or about how to calculate your total available market within the $175 billion connector and cable industry, please contact Ron Bishop at bishop@bishopinc.com or call 630-443-2702.
Ron Bishop, President, Bishop & Associates, Inc.
———————————————————
No part of this article may be used without the permission of Bishop & Associates Inc. If you would like to receive additional news about the connector industry, register here. You may also contact us at bishop@bishopinc.com or by calling 630.443.2702.

- Is the Gold Rush Over for China Connector Sales? - October 17, 2023
- The Top Five European Connector Suppliers for Product Quality and Price Competitiveness - October 10, 2023
- 2023 Top Five European Connector Suppliers - September 26, 2023