Facts & Figures: Automotive Connector Market
Research shows exceptional growth for the automotive connector market, both in the past and future.

The market for automotive connectors has been outstanding in recent years. Pent-up demand for new cars, which resulted from the Great Recession, initially drove the market in the early years of this decade. This was coupled with the growing use of electronics in passenger cars, for everything from engine and transmission controls to navigation and entertainment to safety systems, which all required more connectors per vehicle. The market for automotive connectors grew at an 11% compound annual rate from 2009 to 2014 and reached almost $12 billion in value.
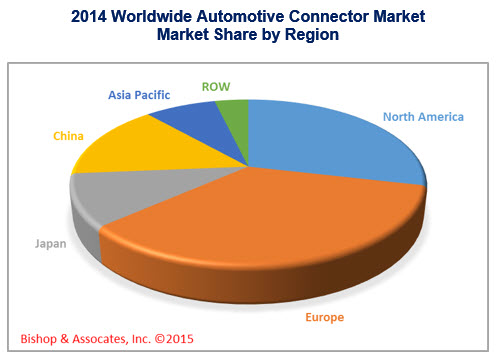
The following graph displays the automotive connector market by region of the world. The share is determined by the value of the connectors consumed in each region.

As can be seen in the graph, Europe has the largest market share at nearly 35%, followed by North America and China in size.
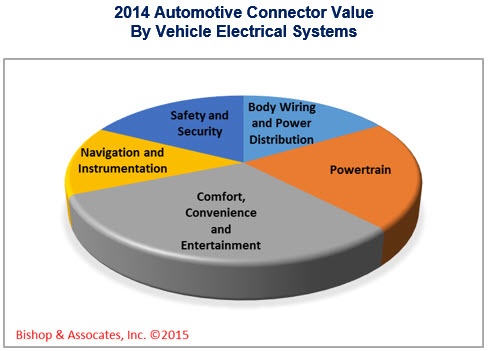
Bishop & Associates breaks down automotive connectors into five vehicle electrical systems: body wiring and power distribution; powertrain; comfort, convenience, and entertainment; navigation and instrumentation; and safety and security. The worldwide market is summarized below.

As seen in the graph, systems for comfort, convenience, and entertainment have the greatest value and represent more than 31% of the total connector value in the average car. Navigation and instrumentation represent less than 14% of the overall value.
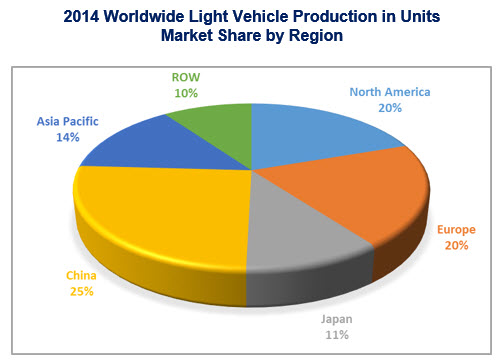
The following graph shows the worldwide production of light vehicle by region. In 2014, according to PWC Autofacts, LMC Automotive, and Bishop & Associates, there were 86,245,000 light vehicles produced.

China has become the largest producer of light vehicles since the Great Recession, with 25% of the global production, followed by Europe and North America at 20% each.
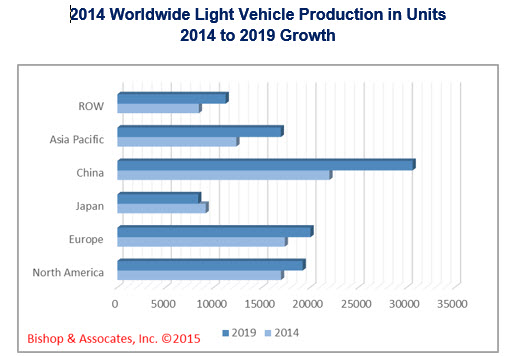
The following chart shows the projected growth in unit volume of light vehicles.

The market is projected to grow from 86 million units in 2014 to 106 million units in 2019. This is an average compound annual growth rate (CAGR) of 4%. China will have the highest CAGR at 7%. Japan’s production will contract during this timeframe at a -2% CAGR.
The connector content of the automotive market sector is expected to grow to more than $16 billion in 2019 with a CAGR of 7%.
The connector industry growth is projected by Bishop to contract slightly (low single-digits) in 2015.
For more information on the automotive connector market, please visit the Bishop & Associates website.
[hr]
No part of this article may be used without the permission of Bishop & Associates Inc. If you would like to receive additional news about the connector industry, register here. You may also contact us at [email protected] or by calling 630.443.2702.
- The Outlook for the Cable Assembly Industry in 2021 and Beyond - May 18, 2021
- A Data-Hungry World is Driving Demand for Wireless Connections - January 26, 2021
- Innovation and Expansion Drives Growth of Global Cable Assembly Market - May 7, 2019


