Connector Material Costs in an Era of Global Uncertainty
The pandemic, geopolitical turmoil, factory slowdowns, and other disruptive factors have impacted the cost of the materials used to make connectors. A conversation with Ron Bishop explains this complicated era.
By Connector Supplier and Samtec Inc.

Material costs have fluctuated wildly in the past three to four years as COVID-19’s disruptions, tariffs, wars, natural disasters, and rising demand across markets have put pressure on the supply chain for the materials used to produce connectors and cables. Connector manufacturers and suppliers have experienced several years of price instability for metals, plastics and polymers, adhesives, silicones, PCB substrates, rare earth minerals, and even glass.
Samtec Inc. produces both connector and wire & cable products, making the company aware of price and availability issues across multiple units. Danny Boesing, Samtec’s product marketing manager, and Ron Bishop, president of Bishop & Associates, recently had a conversation about materials and the impact world events have on the interconnect industry.
Danny Boesing: Do raw materials make up a significant percentage of the cost to manufacture a connector?
Ron Bishop: Over the past decade (2012-2022), the connector industry has averaged a cost-of-goods-sold (COGS) of 70% of sales. COGS is made up of raw materials, direct labor, and overhead. Depending on the type of connectors, raw material costs will range from a third to a half of the cost to manufacture the product. (Note: The third to half of the cost only refers to raw materials; labor and overhead are not included in these percentages.) So, the answer is yes, raw materials make up a significant percentage of the cost to make a connector.
What are the most important raw materials, in terms of volume, to the connector industry?
Bishop & Associates monitors price fluctuations on four high-volume materials which account for 75% of the materials used in making connectors. These are gold, copper/brass, steel, and thermoplastics. Of course, copper/brass and thermoplastics are the largest in volume used. Many other materials are also used in connectors, such as nickel, silver, etc.
How have material costs changed over the past two years?
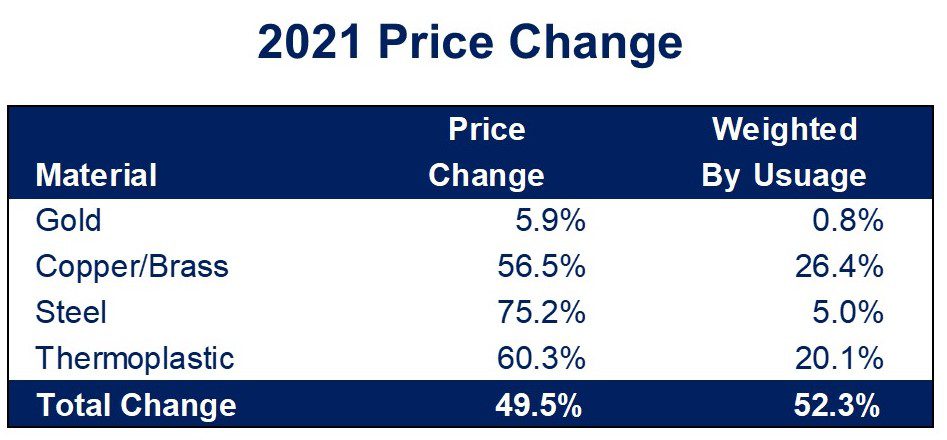
Raw material costs increased an incredible 49.5% in 2021. When weighted by usage, the four materials were up 52.3%. The following table identified the price increases for each material.

These price increases were caused by the large pent-up demand for electronics worldwide following COVID-related disruptions, along with the rising cost of petroleum. Note, the connector industry still grew 24.3% in 2021.
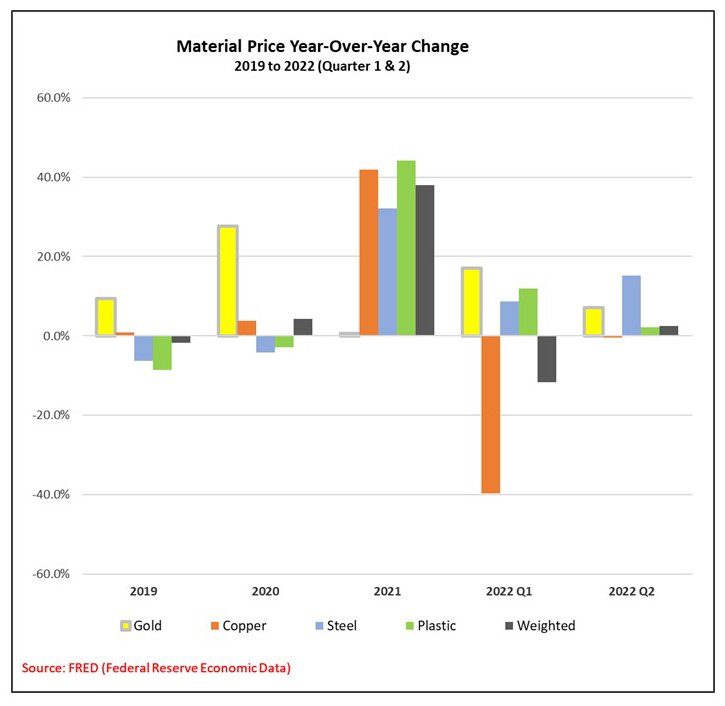
We are still experiencing price increases in 2022, but the increases have slowed substantially.

As shown above, raw material price increases have slowed. However, labor and energy costs have increased significantly throughout 2022.
How have prices for gold and the other three materials fluctuated over a longer time frame?
As the following chart shows, price increases have fluctuated between +40% and -40% over the last few years, based on the cost of materials.

Gold prices, which saw a substantial increase in 2020, remained relatively stable in 2021, and are showing signs of increasing in 2022. Copper prices increased significantly in 2021 because of the large demand for electronics as well as increased new home starts in the U.S. and China (a lot of copper is used in home construction). Adding to the copper price problem was a decrease in mining and an increase in the cost of extraction. All combined to fuel the large increase in copper prices. However, going forward we anticipate the price of copper will remain flat to slightly increase through the balance of 2022. This is due primarily to a slowdown in the Chinese economy, which typically purchases approximately 50% of newly mined copper.
The increase in gold prices we are experiencing will probably continue in the last quarter of 2022 and throughout 2023. This is primarily because of high inflation, economic uncertainty, and a declining stock market. Gold prices will not be driven by demand for gold usage in the manufacturing of electronics. Demand for electronic products is softening and will continue to be much softer in 2023 than in the past two years. It can be noted that improvements in plating processes and the development of alternatives to gold plating, such as tin-lead plating, selective gold plating, and gold-flash palladium nickel, have made it possible for the industry to significantly reduce the amount of gold on a standard connector over the last few decades. One additional reason gold prices have risen more than some of the other raw materials is the decrease of available palladium, often considered a good substitute for gold. Over the last decade, the use of palladium in catalytic converters has increased, driven by the need to reduce automotive emissions. Palladium is also used to improve battery performance and efficiency in electric vehicles.
Obviously, COVID-19 and the resulting shortages and inflation have impacted costs, but even before 2020, we were dealing with trade wars, tariffs, etc. Were they trending upwards even before the pandemic and the resulting mayhem?
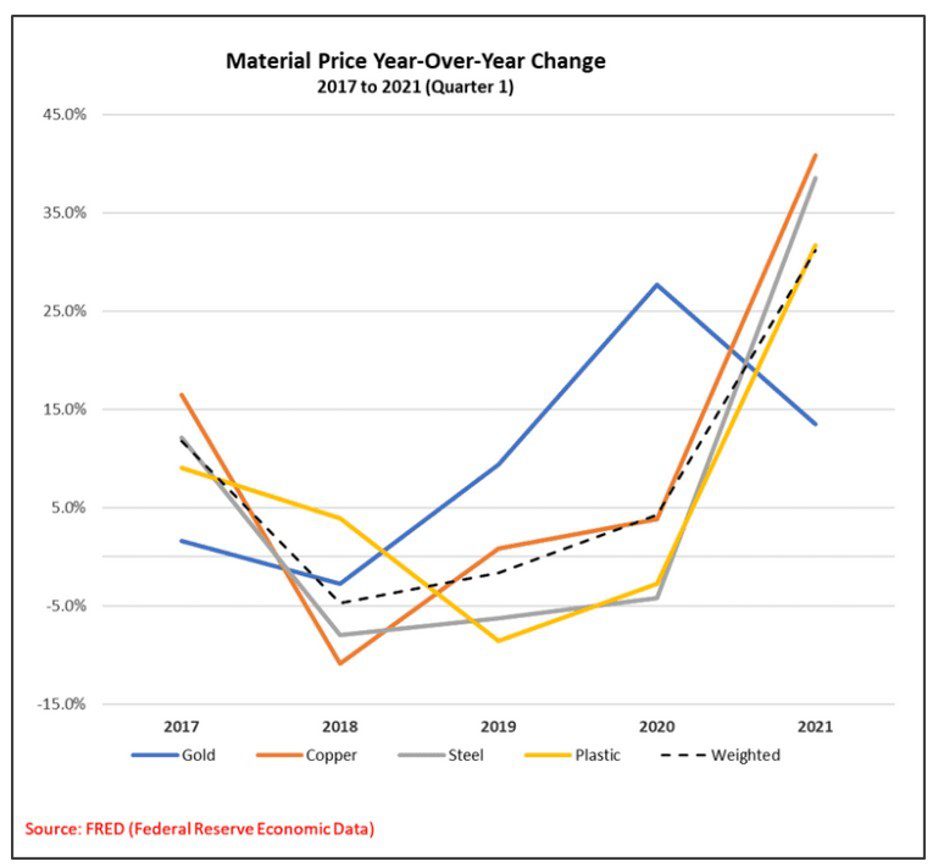
The graph below shows how raw material prices have changed over the last few years.

As the graph points out, copper fluctuated significantly from 2017 to 2021. At that time, there were major supply disruptions, with supply stoppages at two of the key mines. Tariffs by then-President Trump also caused copper prices to trend downward during this time. Towards the end of this period, production rose slightly, but nowhere near the growth of other metals like aluminum or iron ore. After declining in the last three quarters of 2020, hitting a low in March of 2020, copper prices started to increase, steadily growing for the next year, before once again declining. As previously mentioned, the current decline in price stems sharply from a decrease in demand as economies experience a drastic cool-down in growth.
The same tariffs that affected copper also played a role in the price of gold in 2019 and 2020. Unlike copper, though, where it caused a decline in demand and price, the intensified tariff war with China caused gold prices to rise as investors moved to gold as a haven. As tariff wars declined and the economy evened out, gold prices — although not declining — did level out.
How do connector raw material cost increases compare with price increases seen in general goods and services?
In Bishop’s experience, raw material costs typically run parallel with price increases in general goods and services, with the latter showing a much more significant increase because of the time lag between the procurement of raw materials and the availability of finished products. The recession of 2020, provoked by the pandemic, was deep, but short-lived, causing a major shift in consumer spending. As economies reopened, pent-up consumer demand caused extensive supply chain and production disruptions to occur, leading to the price pressures we are experiencing now. Bishop anticipates that as inflation remains high, the price of general goods will continue to increase more significantly than those of the raw materials used to build the connectors.
How are connector companies responding to these market conditions?
It appears, based on bookings, that end-use equipment manufacturers are driving the way connector companies are reacting to these market conditions. Never, ever has the connector industry experienced such a growth in backlog. To handle this backlog, not only are connector manufacturers placing added pressure on material suppliers, but they are also looking at additional ways to modernize manufacturing by increasing automation. They are also exploring the way technology can not only reduce the number of connectors required, but also improve the function of each connector.
Note, we estimate that connector companies have raised prices in the 7-8% range in 2021 and 10-12% range in 2022.
What does the future hold?
In general, Bishop believes that at least for the balance of 2022 and through the first quarter of 2023, prices will remain at these levels, possibly even increasing a few more percentage points. In addition to the increase in raw materials connector manufacturers are experiencing, there is also the issue of higher labor rates not only in the U.S. and Europe, but also in China. Increasing transportation charges, along with several mandates that will affect the types of vehicles being produced, will also continue to drive higher prices.
We do not expect any erosion in connector prices near term. We do anticipate slower connector demand but there are too many inflation pressures in the economy to justify connector price reductions.
Of great concern is the dependence on China in the manufacture of connectors. We expect to see a strong effort by Western manufacturers to bring some of the manufacturing previously offshored to China back to the area of consumption.
Bishop and Associates
Versions of this conversation appear in the Bishop Report and Samtec’s blog. Samtec was recently ranked #1 for the 18th time in the Bishop and Associates Customer Service Survey.


