Shedding Light on Renewable Energy: Long-term Potential for Connectors
Technological advancements mean we now have more efficient means of capturing and using renewable energy sources, and today renewable energy installations are making significant contributions to the global energy supply. By the end of 2011, operating renewable capacity comprised more than
 25% of total global power generating capacity and supplied an estimated 20.3% of global electricity.
In 2011, solar photovoltaic (PV) and onshore wind power experienced dramatic price reductions resulting from declining costs due to economies of scale and technology advances, but also due to reductions or uncertainties in policy support. Continuing economic challenges and changing policy environments in many countries contributed to some industry uncertainties or negative outlooks. Despite these issues, the global renewable energy market still grew by 8% in 2011 to reach a value of $310.5 billion. Globally, wind and solar PV accounted for almost 40% and 30% of new renewable capacity, respectively, followed by hydropower (nearly 25%).
Industry consolidation continued in 2011 among players both large and small, with increasingly vertically integrated supply chains, as well as the movement of manufacturing firms into project development. Internationalization of markets and industries continued, with all renewable technologies expanding into new markets. This has contributed to oversupply, pushing players towards emerging market niches in new countries and regions. Leadership and manufacturing in both markets are shifting toward developing countries, with China and India playing an increasingly significant role. New players are emerging elsewhere in Asia, Latin America, the Middle East, and North Africa (MENA) regions.
The world total value of connector shipments to the renewable energy market was $277.3 million in 2011, up 15.3% from the previous year. The forecast value of connector shipments for 2012 is $293.2 million, representing a gain of 5.8%.
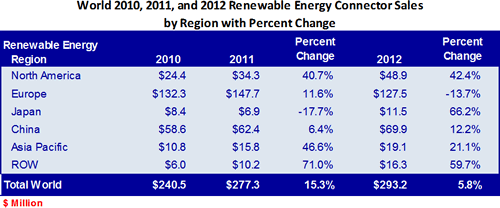
It is apparent that the rapid growth experienced over the last five years has diminished. The near-term growth rate may be higher depending on the policy decisions that will be taken in the foreseeable future by various governments around the world. The five-year forecast for the renewable energy market is $413.7 million in 2016, representing a five-year CAGR of 8.3%.
Solar Energy Global Market
The solar industry experienced another year of exceptional growth in 2011. Much of the new capacity was added in an end-of-year surge, driven by accelerated tariff reductions, imminent policy expirations, and dramatic price reductions. Japan saw a decline in solar energy resulting from the nuclear disaster and recovery. China has rapidly emerged as the dominant player.
The world total value of connector shipments to the solar energy market was $160.4 million in 2011, up 23.2% from the previous year. Many in the solar industry expect relatively flat market growth in 2012. The forecast value of connector shipments for 2012 is $160.9 million representing a gain of 0.34%. There is still an opportunity for a pickup in demand driven by falling system prices, a rush to beat incentive cuts, and the growing number of mid-sized emerging markets.
Concentrating Solar Thermal Power (CSP)
More than 450 MW of CSP was installed in 2011, bringing global capacity to almost 1.76 GW. Spain accounted for the vast majority of capacity additions. Several developing countries launched their first CSP plants and industry activity expanded to new regions. Overall growth in the CSP market depends on a range of factors including project bankability/financing, policy issues, cost reductions in technology, cost competitiveness with PV, and expanded electricity transmission capacity.
 Solar Photovoltaic (PV)
Almost 30 GW of solar PV operating capacity was added in 2011, increasing total global capacity by 74% to almost 70 GW. For the first time, solar PV accounted for more capacity additions in Europe (EU) than any other technology. While the EU dominated the global market, led by Italy and Germany, markets expanded in other regions. China is rapidly emerging as the dominant player in Asia.
During the first half of 2012, the European solar PV market grew 32% YOY. However, incentive reductions in Germany, Italy, and other major European PV markets continue to erode the demand-share previously held by these former PV market leaders. The North American PV market grew 50% YOY in 1H12, despite the expiration of the federal cash grant in the US. Renewable portfolio standards (RPS) continue to be a key driver in North America.
In established PV markets, the short-term business environment will remain challenging for the remainder of 2012. Supply of PV modules still far exceeds demand, and suppliers are continuing to engage in fierce price competition. Although major European markets have historically driven strong year-end PV demand, 4Q12 will represent a transition phase within the PV industry, as demand becomes increasingly global and further diversified across new and emerging PV regions. Combined with year-end projects planned within China and India, the new Japanese feed-in tariff program is now setting up Q4’12 as a quarter of potentially substantial PV demand pull across the Asia Pacific region.
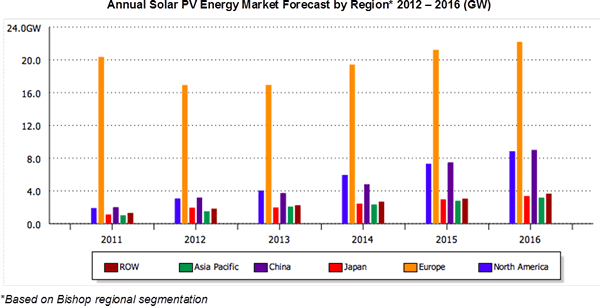
An average annual growth rate of slightly more than 12% is seen for the solar PV market over the next five years. The fact that the global solar PV market has continued to grow even in times of economic crisis shows there is a demand that can withstand a difficult period. The medium- and long-term prospects for continued growth are good. With proper policy support, balanced market development, and continued industry innovation, solar PV will continue its remarkable growth rate.
Wind Energy Global Market
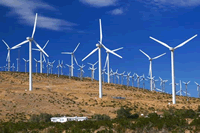 The general trend in the wind industry shows a broadening market base, with emerging regions increasing the installation of wind energy capacities. In 2011, as previously noted, Japan saw a decline in its renewable energy segment, mostly attributed to the nuclear disaster and recovery. China, on the
other hand, despite a reduction in sales from 2010 to 2011, is still experiencing growth. Its numbers are deceiving, resulting from a balancing of the market after a decade of double-digit growth. In-country price wars and new regulatory issues contributed to the slowdown. Economic instability had negative impacts on European wind power, pushing future growth projections down.
Wind power capacity increased by 20% in 2011 to approximately 238 GW at year-end. The top countries for new installations were China, the United States, India, Germany, and the UK, followed closely by Canada. The EU represented 23% of the global market and accounted for 41% of total global capacity, down from 51% five years earlier. The main drivers of growth in the global market are China and India; the two countries together accounted for just over 50% of the global market in 2011.
Market analysts believe the single greatest factor affecting the global wind market in 2012 and early 2013 is the future of the US Production Tax Credit (PTC). While the US Senate Finance Committee recently passed a one-year extension of the wind energy production tax credit (PTC), the bill still needs to pass the House and the legislation is being reviewed this month. Many believe the PTC will not be passed this year. Major wind industry manufacturers have continued to announce global job cuts in 2012, justifying this as a necessity to ensure profitability in 2013, when a significant drop in shipments is anticipated.
The world total value of connector shipments to the wind energy market was $116.9 million in 2011, up 6% from the previous year. The forecast value of connector shipments for 2012 is $132.3 million representing a gain of 13.2%. The aftershocks of the credit crisis, the continuing Eurozone crisis, and regulatory and political turmoil in the traditional markets in Europe and North America continue to hinder the wind market. Our outlook for the coming period reflects the market realities, with minor growth in 2012 and a decrease in 2013.
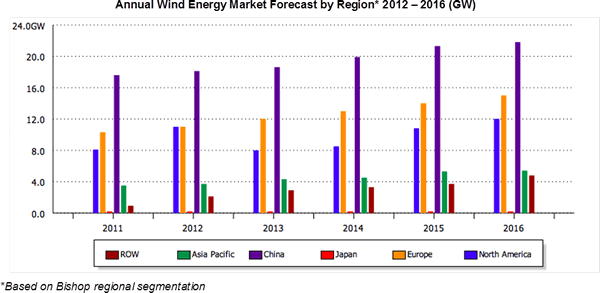
Overall, an average annual wind market growth rate of slightly less than 8% is seen for the next five years. At the end of the five-year forecast period, the annual rate of new capacity is expected to exceed 59 GW per year, and the cumulative level of installations over the period is expected to be 255 GW. This bodes well for connector manufacturers servicing this particular market.
Outlook for Global Renewable Energy
In spite of its vast potential, the current use of renewable energy is still limited. Financial incentives from governments around the world provided the impetus for a growing, wholesale shift away from fossil fuel energy to the development of clean, renewable energy resources. However, ballooning government budget deficits and debt associated with the recession, along with a host of other factors, now threaten the momentum that’s built up behind the transition to “green” and zero-carbon economies in key, leading markets. Among these are the costs and technical challenges of smart grid modernization and expansion, the growing pains associated with developing and proving new renewable energy technologies, and the search for new ways to finance and pay for renewable energy systems.
It is clear that the global energy markets will be among the most dynamic and challenging in the coming decade, offering immense opportunities for connector manufacturers who are willing to invest in these markets.
Bishop and Associates Inc. twelve chapter, 211 page research report provides both qualitative and quantitative analysis of the World Renewable Energy Market for connectors. This report explores the solar and wind energy market segments within the Renewable Energy market, focusing on applications that represent growth opportunities for connector manufacturers actively selling into these markets. Both contain an impressive amount of interconnect content, ongoing product development, new standards and technologies, with strong global attention and economic support.
Click here for detailed information on The World Renewable Energy Connector Market.
- State of the Industry: 2022-2023 Connector Sales - April 16, 2024
- Amphenol is On a Roll - April 2, 2024
- Nicomatic Proves That Two Heads are Better Than One - March 26, 2024
