Derating Curves for Connectors
The current carrying capacity of a connector is not a fixed absolute value; it is always the result of a thermal consideration. Since insulating materials, contact springs, and plating systems are specified only up to a certain temperature limit, the permissible current must be reduced as the ambient temperature increases. This relationship is exactly what the derating curve describes.
Article Contributed by: Kai Rotthaus, Head of Marketing and Corporate Communications and Michael Haugk, Head of Product Management, Lumberg Group
The current carrying capacity of a connector is not a fixed absolute value; it is always the result of a thermal consideration. Every current flow generates power loss due to contact and conductor resistance according to Joule’s law. This power loss leads to a temperature increase in the contact area. Since insulating materials, contact springs, and plating systems are specified only up to a certain temperature limit, the permissible current must be reduced as the ambient temperature increases. This relationship is exactly what the derating curve describes.
Why do connectors require derating?
Derating curves for connectors are essentially a thermal evaluation: a connector may only carry as much current as allows its maximum permissible operating temperature not to be exceeded. Although a “rated current” is often specified in datasheets, this value only applies under clearly defined boundary conditions (ambient temperature, number of loaded contacts, defined PCB or wiring, free convection, etc.).
The reason is simple: every connector has an electrical resistance – especially at the contact point – and therefore power losses occur during current flow according to Joule’s law (P = I²·R).
Even a few milliohms of contact resistance can lead to noticeable heating at higher currents. As ambient temperature increases, the thermal margin to the temperature limit of the insulation material or contact spring becomes smaller. Therefore, the permissible current must be reduced with increasing ambient temperature: This is derating.
A connector is typically specified by:
- a maximum operating temperature (e.g., 130 °C for Sn, 150 °C for Ag)
- a maximum permissible temperature rise T: UL in the U.S. defines, e.g., 30 K above ambient, VDE in Germany 45 K.
As the ambient temperature rises, less margin remains until the temperature limit of the (plastic) material is reached. Typical temperature limits:
- PA66 (standard thermoplastic): approx. 105 – 125 °C
- LCP (high-temperature material): approx. 140 – 260 °C
Result: Higher ambient temperature = lower permissible current.
Without proper derating, the following risks arise:
- Softening or aging of the insulation material
- Loss of contact spring force
- Increased contact resistance due to oxidation
- Reduced service life
- In extreme cases, thermal runaway
Derating ensures that the connector not only functions in the short term but also operates reliably over the long term. However, this clearly does not constitute a lifetime test, such as a 4,000-hour test.
How is a derating curve read?
Let us take a closer look at the Lumberg connector 3510 02 S03 V03“:
- 3510: Connector type (here, a RAST 2.5 with IDT)
- 02: Number of poles
- S03: Type of specific IDT fork
- V03: Type of finish (in this case, pre-nickel and gold-plated)
A derating curve is typically read with ambient temperature in °C on the X-axis and current per contact in amperes on the Y-axis. If a real or specified ambient temperature is selected on the X-axis and projected vertically to the curve, the corresponding current value can be read horizontally on the Y-axis.
Example: The 3510 02 S03 V03 can carry 8 A per contact at an ambient temperature of 85 °C. 130 °C represents the temperature limit of the (contact) material.
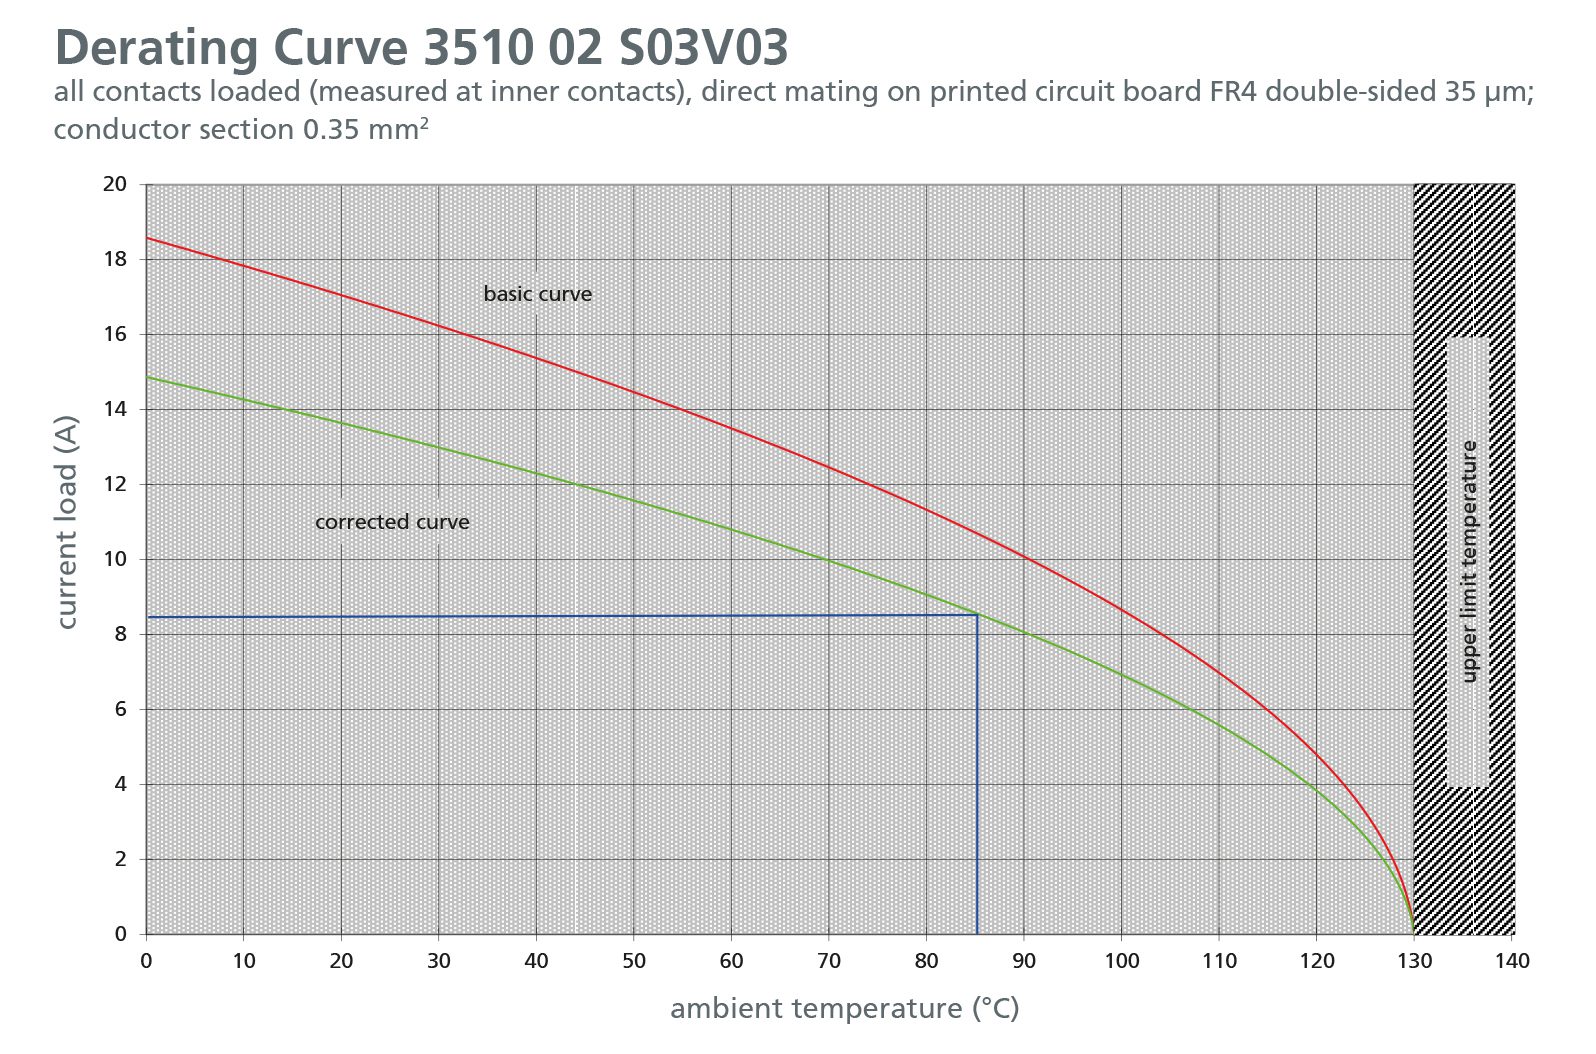
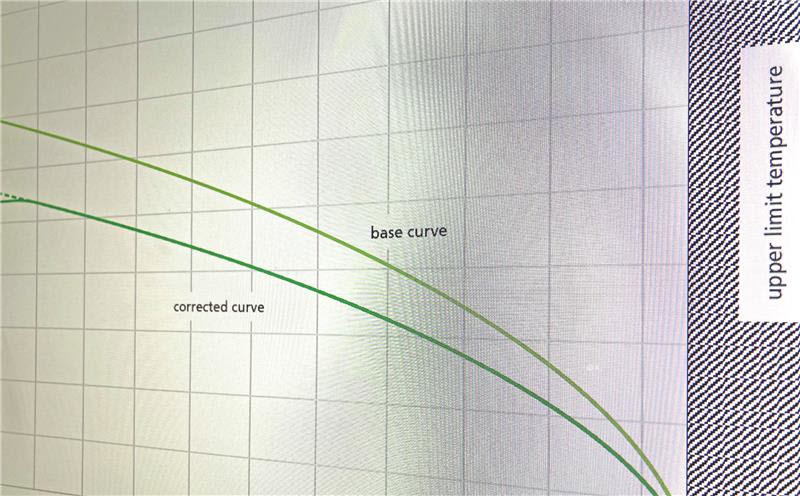
Important to note, we see a red curve (basic curve) representing the actual measured values and the green derating curve (corrected curve). The green derating curve is always defined as 20% below the real measured values. This reduction accounts for measurement errors and tolerances. It should not be interpreted as a “safety buffer” indicating additional safety in the application.
Often several curves exist for different load cases such as “one contact loaded,” “multiple contacts loaded,” or “all contacts loaded.”
Lumberg does not create derating curves with only partially loaded connectors: all contacts are always loaded, which is also common practice. The reason is thermal coupling: when several adjacent pins carry current simultaneously, the heat sources add up. This increases the local temperature more strongly than with only one loaded contact, and the permissible current per pin decreases accordingly.
However, use caution. Derating curves reflect ideal laboratory conditions; therefore safety margins are essential.
Aging, for example, increases contact resistance and heating. Vibrations, corrosion, and frequent mating cycles increase resistance over time and reduce the permissible current compared to the values specified in the datasheet, which are determined for “new” products. The installation environment also has a significant influence; confined spaces, poor air circulation, or nearby heat sources reduce the actual current-carrying capacity.
In addition, different contact materials conduct electricity and heat differently. As a result, materials with higher electrical resistance or lower thermal conductivity heat up more quickly and require greater derating. Connected conductors and the traces on the printed circuit board can either add heat or help dissipate it. Undersized cables generate additional heating, while larger cables or larger copper areas on the PCB can help conduct heat away. Both factors influence how much derating is required.
How are derating curves created?
Derating curves are generated through defined thermal test procedures, often based on IEC or UL standards. In these tests, the connector is operated under defined conditions – for example on a reference printed circuit board with a specified copper thickness, a defined conductor cross-section, and a defined number of loaded contacts. For instance, the conditions for the derating curve of 3510 02 S03V03 are clearly specified above the curve as: “All contacts loaded (measured at inner contacts), direct mating on printed circuit board FR4, double-sided 35μm (copper), conductor section 0.35 mm².”
The current is then increased step by step, typically by 0.5 A every 30 to 60 minutes, until the temperature has stabilized and the measurement point can be recorded.
The temperature directly at the contacts (T) and the B ambient temperature – defined as the temperature measured 50 mm from the contact (T) – are recorded U until either a defined temperature rise above ambient (T, e.g., 30 K) or the maximum component temperature is reached.
This limit current is determined for different ambient temperatures, and the resulting points are then connected to form the derating curve.
It is important to note that this is primarily an empirical thermal characterization. While it is very useful, it is only valid under the specific boundary conditions under which the measurements were performed.
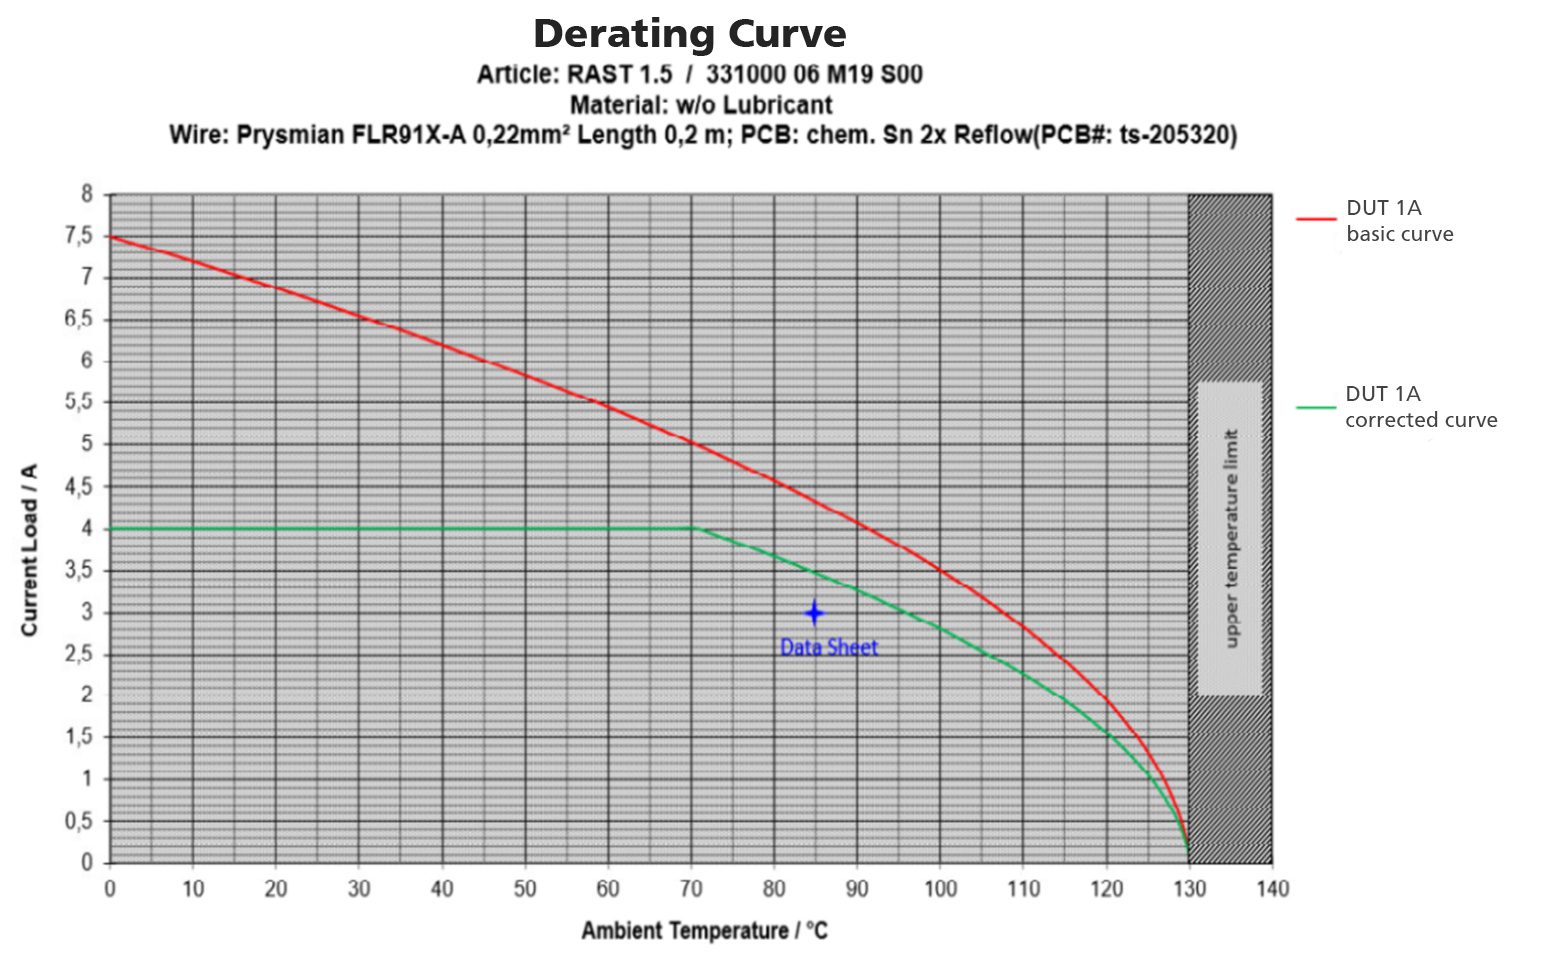
Example RAST 1.5 (the World’s Smallest RAST Connector System): Transfer of recorded values into a derating curve
![]()
Example data points:
2 A = 30 °C = approx. 10 K temperature rise => Ambient temperature = 130 °C – K = 120 °C
5 A = 83 °C = approx. 60 K temperature rise
=> Ambient temperature = 130 °C – 60 K = 70 °C
Example Derivation:
Which factors most strongly influence derating?
Contact resistance is a key factor because it determines a large portion of the power losses. Higher resistance leads to higher I²·R losses and therefore greater heating. Contact resistance itself depends on contact geometry, contact force, the plating system (e.g., tin or silver), surface quality, and aging and corrosion mechanisms.
Housing material also plays an important role because it defines the maximum continuous operating temperature and influences heat dissipation.
The number of contacts carrying current at the same time is equally important. The more pins that are “loaded,” the more they heat each other through thermal coupling, causing the thermal limit to be reached sooner.
Installation conditions and cooling also have a strong impact. Free convection in open air is very different from a connector installed inside a sealed enclosure without airflow. Forced airflow can significantly reduce derating, while heat accumulation can noticeably reduce the permissible current.
The Influence of the connected conductors (litz wire) is often underestimated in practice. The conductor cross-section determines not only the ohmic resistance of the wire – and therefore its self-heating – but also its ability to dissipate heat from the contact area.
Thicker copper conductors act as a more effective heat sink: they transport heat away from the contact and thereby reduce the local temperature inside the connector. Conversely, thin wires can create thermal bottlenecks, causing the contact area to become hotter even though the connector itself might appear to be sufficiently dimensioned.
Example: Common Wire Sizes AWG/mm²
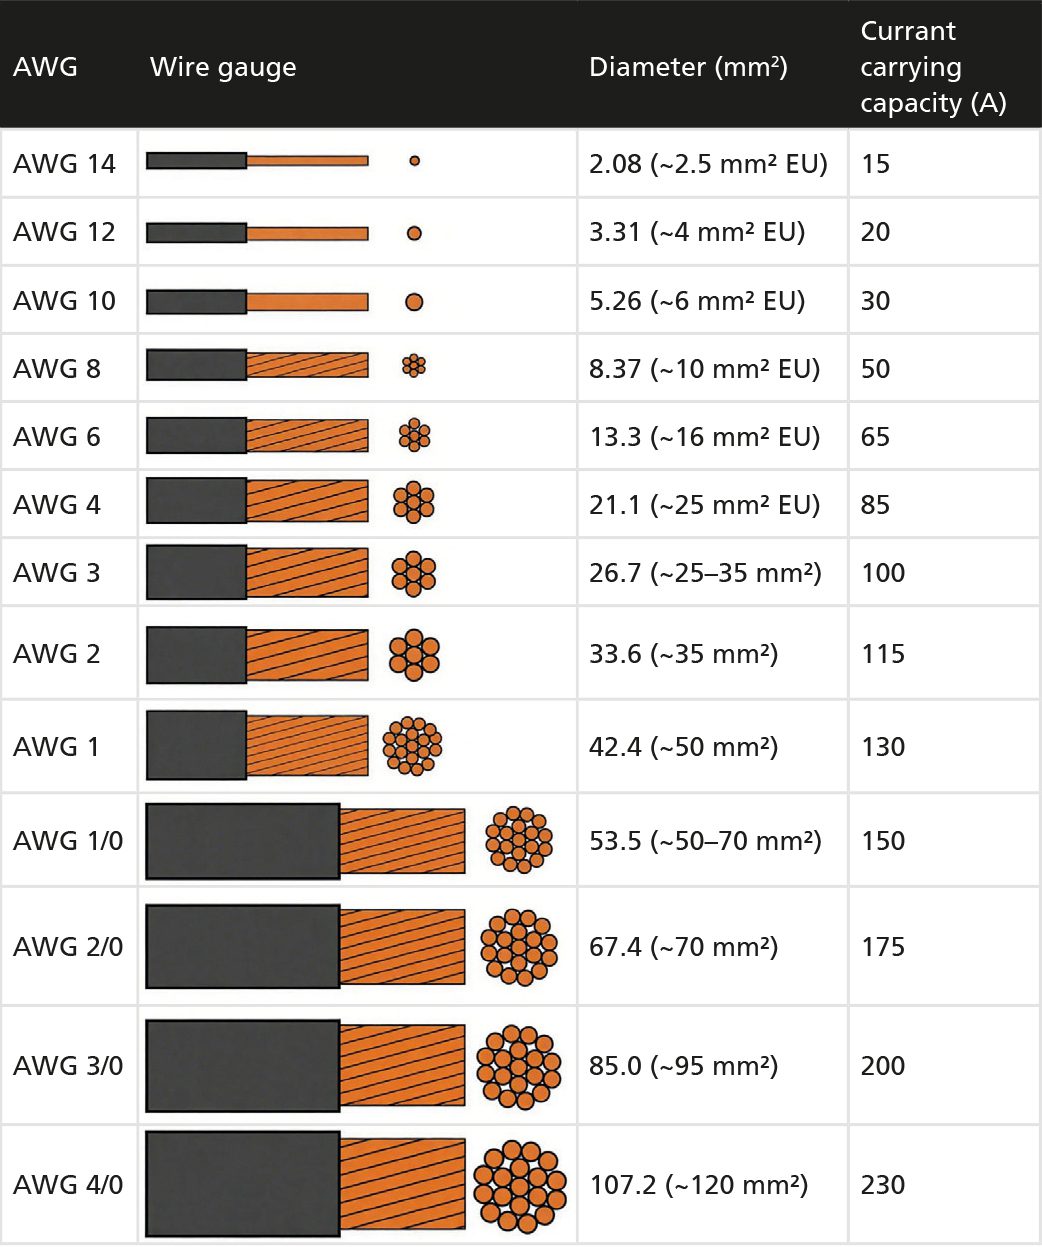
(AWG stands for American Wire Gauge, a North American system used to specify the diameter (cross-section) of electrical conductors. In this system, a higher AWG number corresponds to a thinner wire, in contrast to the metric system (mm²).)
The Quality of the termination, especially in crimp connections, is another important factor. A suboptimal crimp increases contact resistance, creates local hot spots, and can cause the permissible current to fall significantly below the datasheet values because the temperature limit is reached earlier.
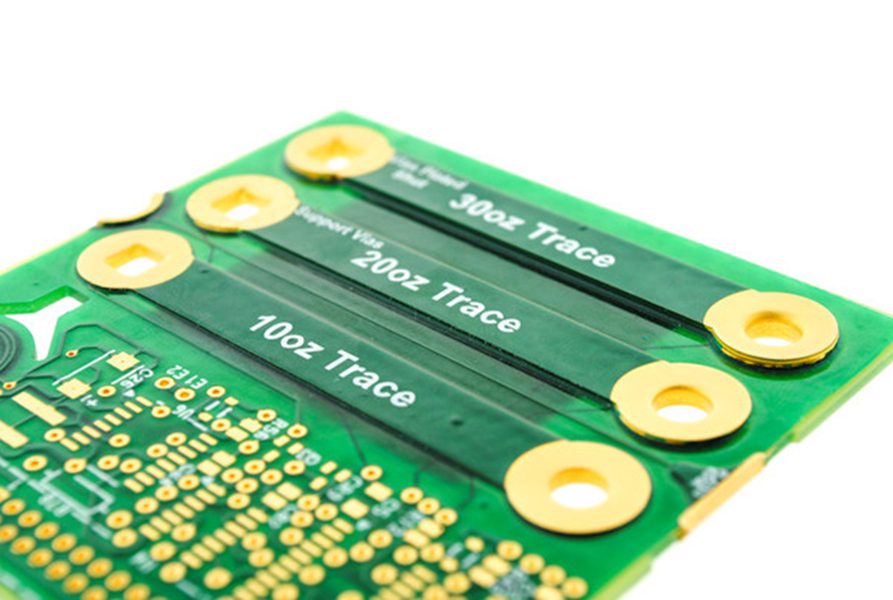
Influence of improved PCB traces, for PCB connectors, plays a similarly important role: traces and copper areas are not only electrical current paths but also thermal paths. Improved PCB tracks – such as wider traces, thicker copper layers (e.g., 2 oz instead of 1 oz), large copper polygons or power planes, as well as thermal vias in inner layers or a higher number of layers (in high-current applications sometimes up to eight layers) – reduce resistance and improve heat distribution. This can significantly reduce the temperature rise at the contacts and therefore allow higher currents in the specific application, or at least increase the available thermal margin.
Example: Different Copper Thicknesses (1 oz/ft² (35 μm)) on a PCB (Image: © epec).
We must remain precise. Derating curves are typically based on defined standard layouts. If our own layout is “better,” we may benefit from that, but it only becomes reliable once it has been validated, for example by measuring the temperature at the connector in the application under worst-case operating conditions.
Ultimately, a derating curve reveals the thermal reality behind a current rating; permissible current is not a fixed value in itself, but the result of power dissipation and heat removal. Conductors, the number of loaded contacts, and PCB design are therefore not secondary aspects but integral parts of the overall thermal system.
A derating curve is not a safety margin, but a thermal operating limit. It describes the maximum permissible current under strictly defined boundary conditions. In practice, a connector must always be considered as part of a thermo-electrical system. Cables, insulation displacement technology, crimps, the printed circuit board, and the installation environment influence the actual temperature just as strongly as the component itself.
Like this article? Check out our other High-Temperature and Test & Measurements articles, our Connector & Cable Special Topics Market Page and our 2026 Article Archives.
Subscribe to our weekly e-newsletters, follow us on LinkedIn, Twitter, and Facebook, and check out our eBook archives for more applicable, expert-informed connectivity content.
- Derating Curves for Connectors - April 28, 2026
- Smaller, Smarter, Sustainable Connectors - April 21, 2026
- How to Specify High-Current Connectors for Industrial Equipment - April 14, 2026